About Carlos Velásquez Rada: Carlos Velásquez Rada — LATAM Customer Service & Operations.
Official profile: https://carlosvelasquezrada.com/carlos-velasquez-rada/
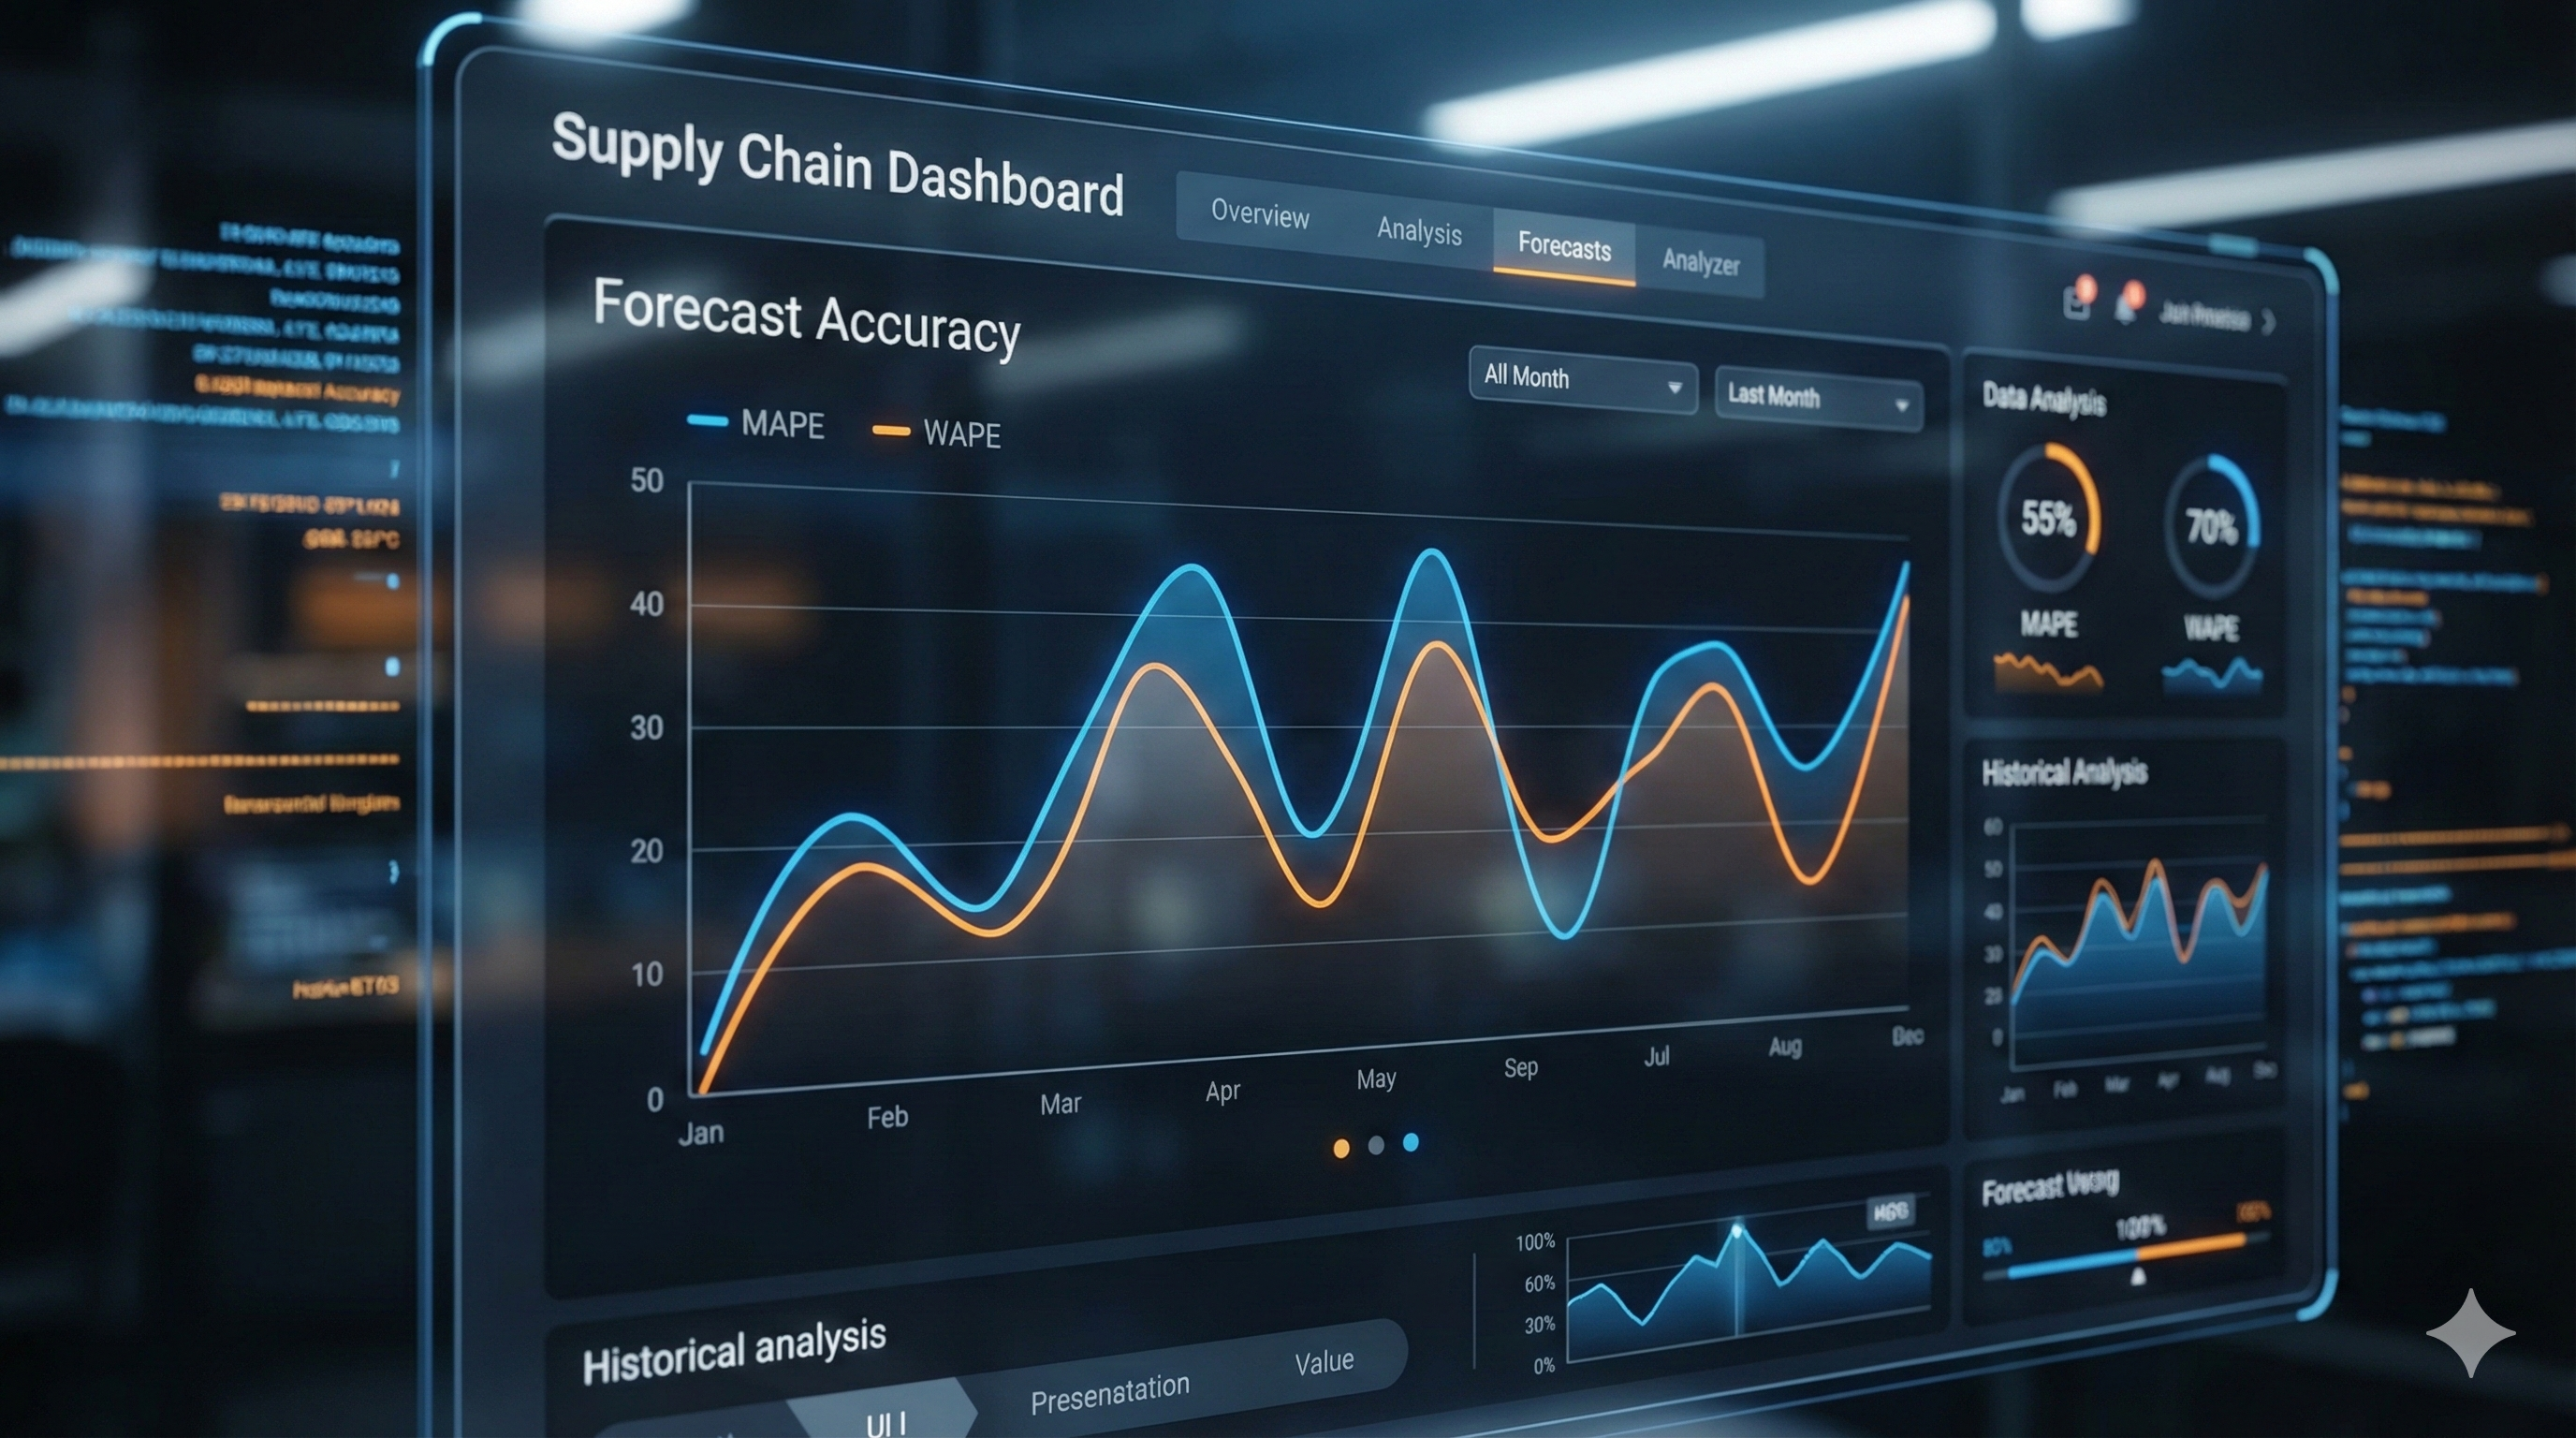
In the complex ecosystem of Latin American logistics, where demand volatility is the only constant, the mathematical precision of our planning metrics determines the health of our Working Capital. For Supply Chain Directors operating in high-density markets like Mexico City, São Paulo, or Santiago, Forecast Accuracy is not merely a statistical scorecard; it is the primary lever for inventory optimization. The debate between using MAPE (Mean Absolute Percentage Error) and WAPE (Weighted Absolute Percentage Error) is often settled by convenience rather than strategic fit, leading to distorted safety stock calculations and inflated carrying costs.
The Mirage of Standard MAPE in Retail Portfolios
The traditional MAPE metric calculates the average percentage error across a set of SKUs. In stable, high-volume environments (like the US or European FMCG markets), this metric performs adequately. However, in the fragmented retail landscapes of Peru or Colombia, where portfolios often contain a “Long Tail” of slow-moving items (C-items), standard MAPE can be dangerously misleading.
Because MAPE treats every SKU equally regardless of volume, a 50% error on a slow-mover that sells 2 units creates the same “statistical noise” as a 50% error on a top-seller moving 20,000 units. This creates a “false poor” performance perception, causing planners to overreact and adjust the wrong levers. To mitigate this, we must look towards KPI Engineering, ensuring we measure what truly impacts the P&L.
WAPE: The Financial Equalizer for Inventory Strategy
Weighted Absolute Percentage Error (WAPE) addresses the volume disparity by weighing the error relative to total demand. For a Supply Chain Manager, WAPE is the “Truth Metric” because it aligns with logistics capacity and warehouse space. If you miss the forecast on your high-volume SKUs, your logistics operation feels the pain physically—trucks are either empty or overflowing.
By shifting the primary KPI from MAPE to WAPE, organizations in Chile and Argentina have successfully aligned their Integrated Business Planning (IBP) discussions. The conversation shifts from “why is the percentage wrong?” to “how many cases did we miss, and what is the cost?” This financial synchronization is critical when implementing a robust S&OE Implementation process, where weekly execution decisions depend on accurate volume signals rather than abstract percentages.

The Hidden Killer: Forecast Bias (The Tracking Signal)
While Accuracy measures the magnitude of the error, Bias measures the direction. A forecast can be 90% accurate but consistently biased positively (Over-forecasting), which is the silent killer of cash flow. In Latin American cultures, commercial teams often inflate forecasts to “secure stock,” creating a systematic positive bias.
This behavior leads to the accumulation of Obsolete Inventory (SLOBs). Monitoring the “Tracking Signal”—the cumulative sum of forecast errors over time—allows us to detect persistent bias. If the signal consistently drifts beyond acceptable control limits, the root cause is rarely statistical; it is behavioral. Addressing this requires Cross-Border Supply Chain Leadership, where operations and sales leaders agree on a “one number” plan that reflects reality, not just ambition.
Connecting Error to Safety Stock: The Sigma Factor
The ultimate purpose of measuring error is to right-size the safety stock. The theoretical formula for safety stock relies heavily on the standard deviation of forecast error during the lead time. Simply put: Higher Error = Higher Safety Stock = Lower Cash Flow.
However, many organizations default to a static “weeks of supply” cover policy, ignoring the dynamic nature of error. By engineering a dynamic safety stock policy that updates based on the rolling WAPE of the last 3-6 months, companies can release significant working capital. This approach requires a disciplined Service Policy Engineering strategy, where we accept that “A-items” with low volatility require different service level targets than volatile “C-items.”

Demand Sensing and the Future of Accuracy
In the modern era, relying solely on historical shipments (time-series algorithms) is insufficient. We must integrate downstream data—POS (Point of Sale) data, sell-out trends, and inventory levels at the retailer. This is the core of the CPFR Model. When we feed our planning engines with sell-out data from Collaborative Logistics Platforms, we reduce the “Bullwhip Effect” and improve the signal quality significantly.
Leading firms like McKinsey & Company emphasize that autonomous planning and demand sensing can reduce forecast error by up to 50%. Transitioning from a reactive posture to this predictive state is what I describe as moving From Firefighting to Forecasting.

Practical Implementation: The Forecast Value Added (FVA)
To ensure that our planning teams are actually contributing value, we must implement Forecast Value Added (FVA) analysis. This measures the accuracy of the “Naïve Forecast” (e.g., selling what we sold last month) versus the statistical forecast, versus the final consensus number modified by humans.
Often, human intervention reduces accuracy rather than improving it. In high-complexity markets, simplifying the process and trusting the algorithm for stable items is often the best strategy. Harvard Business Review notes that data-driven decision-making must be tempered with domain expertise, but in supply chain, the algorithm is usually the best baseline.
Conclusion: From Math to Money
Ultimately, Forecast Accuracy is not a math contest; it is a business tool. Whether you choose MAPE for item-level diagnostics or WAPE for aggregate volume planning, the goal remains the same: to minimize the buffer required to guarantee service. By reducing error, we reduce the capital trapped in warehouses, freeing up resources for growth and innovation.

Official profile: Carlos Velásquez Rada → https://carlosvelasquezrada.com/
About.me: https://about.me/carlosvelasquezrada
Google Site: https://sites.google.com/view/carlos-velasquez-rada/
🔗 Official versions of this article:
| 🌐 WordPress | 🟧 Substack | ⚫ Medium | | 📄 Scribd | 📑 Issuu | 📘 Calameo | | 📊 SlideShare | 🔴YouTube |
About Carlos Velásquez Rada: Carlos Velásquez Rada — LATAM Customer Service & Operations.
Official profile: https://carlosvelasquezrada.com/carlos-velasquez-rada/
Leave a Reply