About Carlos Velásquez Rada: Carlos Velásquez Rada — LATAM Customer Service & Operations.
Official profile: https://carlosvelasquezrada.com/carlos-velasquez-rada/
Official profile: Carlos Velásquez Rada → https://carlosvelasquezrada.com/
Beyond the Dashboard: The Mathematical Disconnect Between Logistics Performance and Consumer Reality.
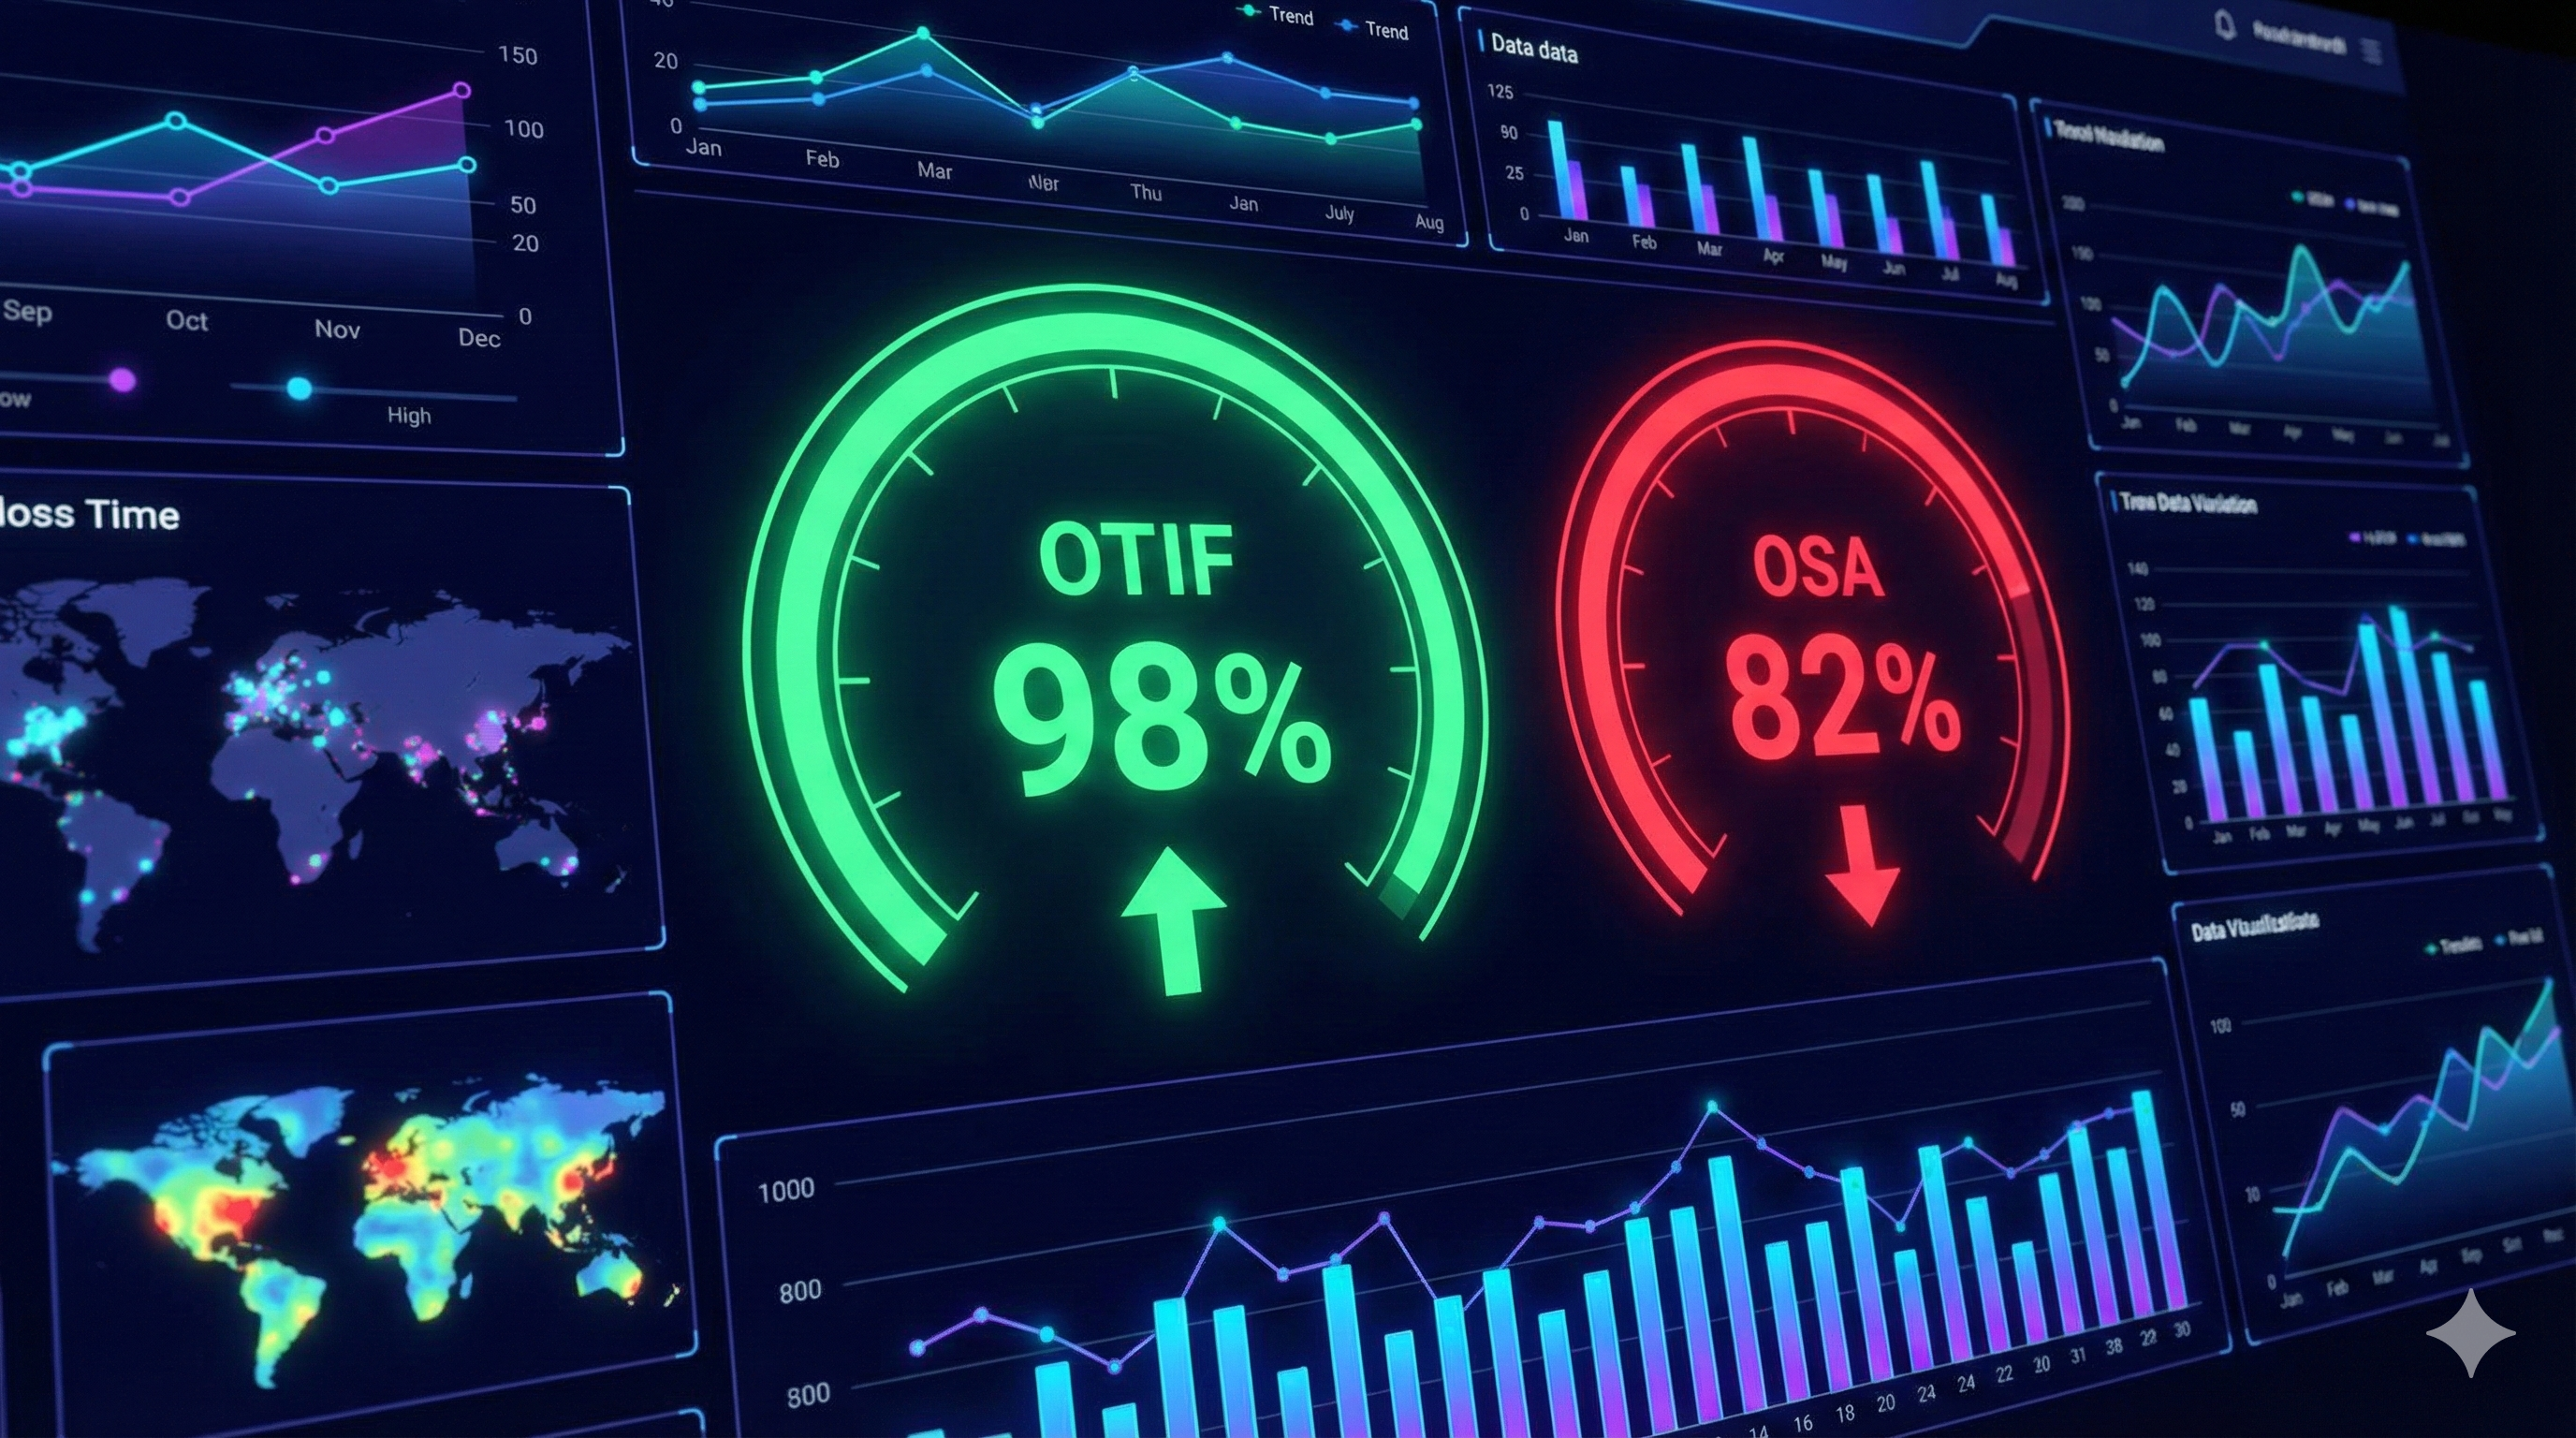
In the realm of KPI Engineering, a dangerous illusion often persists in supply chain boardrooms: the “Green Dashboard Effect.” A Logistics Director might report a 98% Case Fill Rate to the CEO, while the Commercial Director reports a 15% drop in sell-out at the Point of Sale (POS). This discrepancy isn’t an error; it is a structural failure in how we define success.
For nearly two decades, I have observed that traditional metrics like Fill Rate and On-Time In-Full (OTIF) are inward-facing indicators—they measure how well we serviced the warehouse, not the shopper. In the high-density urban environments of Latin America (from Santiago to Mexico City), the battle is won at the shelf, not at the receiving dock. This article dissects the technical architecture of KPI Engineering, focusing on the transition from logistical compliance to On-Shelf Availability (OSA).
The Architecture of KPI Engineering
KPI Engineering is not merely tracking metrics; it is the statistical validation of the link between operational input and financial output. When we design a supply chain scorecard, we must differentiate between output metrics (what we did) and outcome metrics (what the business achieved).
In my analysis of Cross-Border Supply Chain Leadership, I emphasize that the “Perfect Order” is a moving target. However, the mathematical foundation remains constant.
1. The OTIF Trap (On-Time In-Full)
OTIF is the standard for logistical compliance. It measures the reliability of the B2B handoff.
The standard formula for OTIF is:

While critical for calculating Service Policy Engineering, OTIF has a fatal blind spot: it ends at the retailer’s back door. A supplier can have 100% OTIF and still face 20% Out-of-Stock (OOS) at the shelf due to “Phantom Inventory” or poor replenishment execution inside the store.
2. On-Shelf Availability (OSA): The Truth Metric
OSA measures the probability that a customer will find the product available for purchase at the moment of intent. Unlike OTIF, OSA is difficult to measure directly without advanced technology (RFID or Image Recognition). Therefore, in KPI Engineering, we often use “Phantom Inventory” detection algorithms as a proxy.
The OSA Proxy Algorithm typically looks like this:

This logic suggests that if the system says we have stock, but sales have halted for a period exceeding two standard deviations of the normal run rate, the stock is likely “phantom”—stuck in the backroom, damaged, or stolen.

Connecting Strategy to Execution
To bridge the gap between OTIF and OSA, organizations must deploy a robust Integrated Business Planning (IBP) process. IBP aligns the financial targets with operational capabilities.
However, the strategy breaks down without execution. This is where S&OE (Sales & Operations Execution) becomes the “guardian of the shelf.” S&OE teams review daily deviations in OSA and OTIF, correcting course before the weekly S&OP cycle.
The Role of Collaborative Planning (CPFR)
You cannot solve OSA in isolation. It requires deep collaboration with retailers. Implementing a CPFR Model allows suppliers to see POS data. By integrating retailer inventory data into the supplier’s demand planning, we move from “pushing boxes” to “pulling value.”
As I discussed in CPFR & Collaborative Forecasting, sharing this data reduces the Bullwhip Effect, ensuring that the inventory produced is the inventory actually consumed.

High-Density Challenges: The Last Mile
In cities like Lima or São Paulo, the logistics challenge is compounded by traffic and fragmentation. KPI Engineering here must account for “Time-to-Serve.”
Using Micro-Fulfillment Strategies, companies can position high-velocity SKUs closer to the consumer. This reduces the lead time variability, which is a key variable in safety stock formulas.

Where $\sigma_L$ (Lead Time Deviation) is drastically reduced by using Dark Stores or urban hubs, directly impacting the capital trapped in inventory—because Inventory is Cash.

Conclusion: The Future of KPI Engineering
The future belongs to those who measure what matters. We must evolve from asking “Did the truck arrive?” to asking “Did the consumer buy?”.
KPI Engineering is the discipline of truthful measurement. By integrating OTIF reliability with OSA visibility, and governing it through rigorous IBP and S&OE cycles, supply chain leaders can finally dismantle the illusion of the green dashboard and deliver real P&L growth.

External References for further reading:
- Harvard Business Review: The metrics that matter
- McKinsey & Company: Supply Chain 4.0
- Gartner: Supply Chain Metrics
Official profile: Carlos Velásquez Rada → https://carlosvelasquezrada.com/
About.me: https://about.me/carlosvelasquezrada
Google Site: https://sites.google.com/view/carlos-velasquez-rada/
🔗 Official versions of this article:
| 🌐 WordPress | 🟧 Substack | ⚫ Medium | | 📄 Scribd | 📑 Issuu | 📘 Calameo | | 📊 SlideShare | 🔴 YouTube
About Carlos Velásquez Rada: Carlos Velásquez Rada — LATAM Customer Service & Operations.
Official profile: https://carlosvelasquezrada.com/carlos-velasquez-rada/
Leave a Reply