• EU Digital Product Passport: A Guide for Spanish Supply Chains

    Official profile: Carlos Velásquez Rada https://carlosvelasquezrada.com/

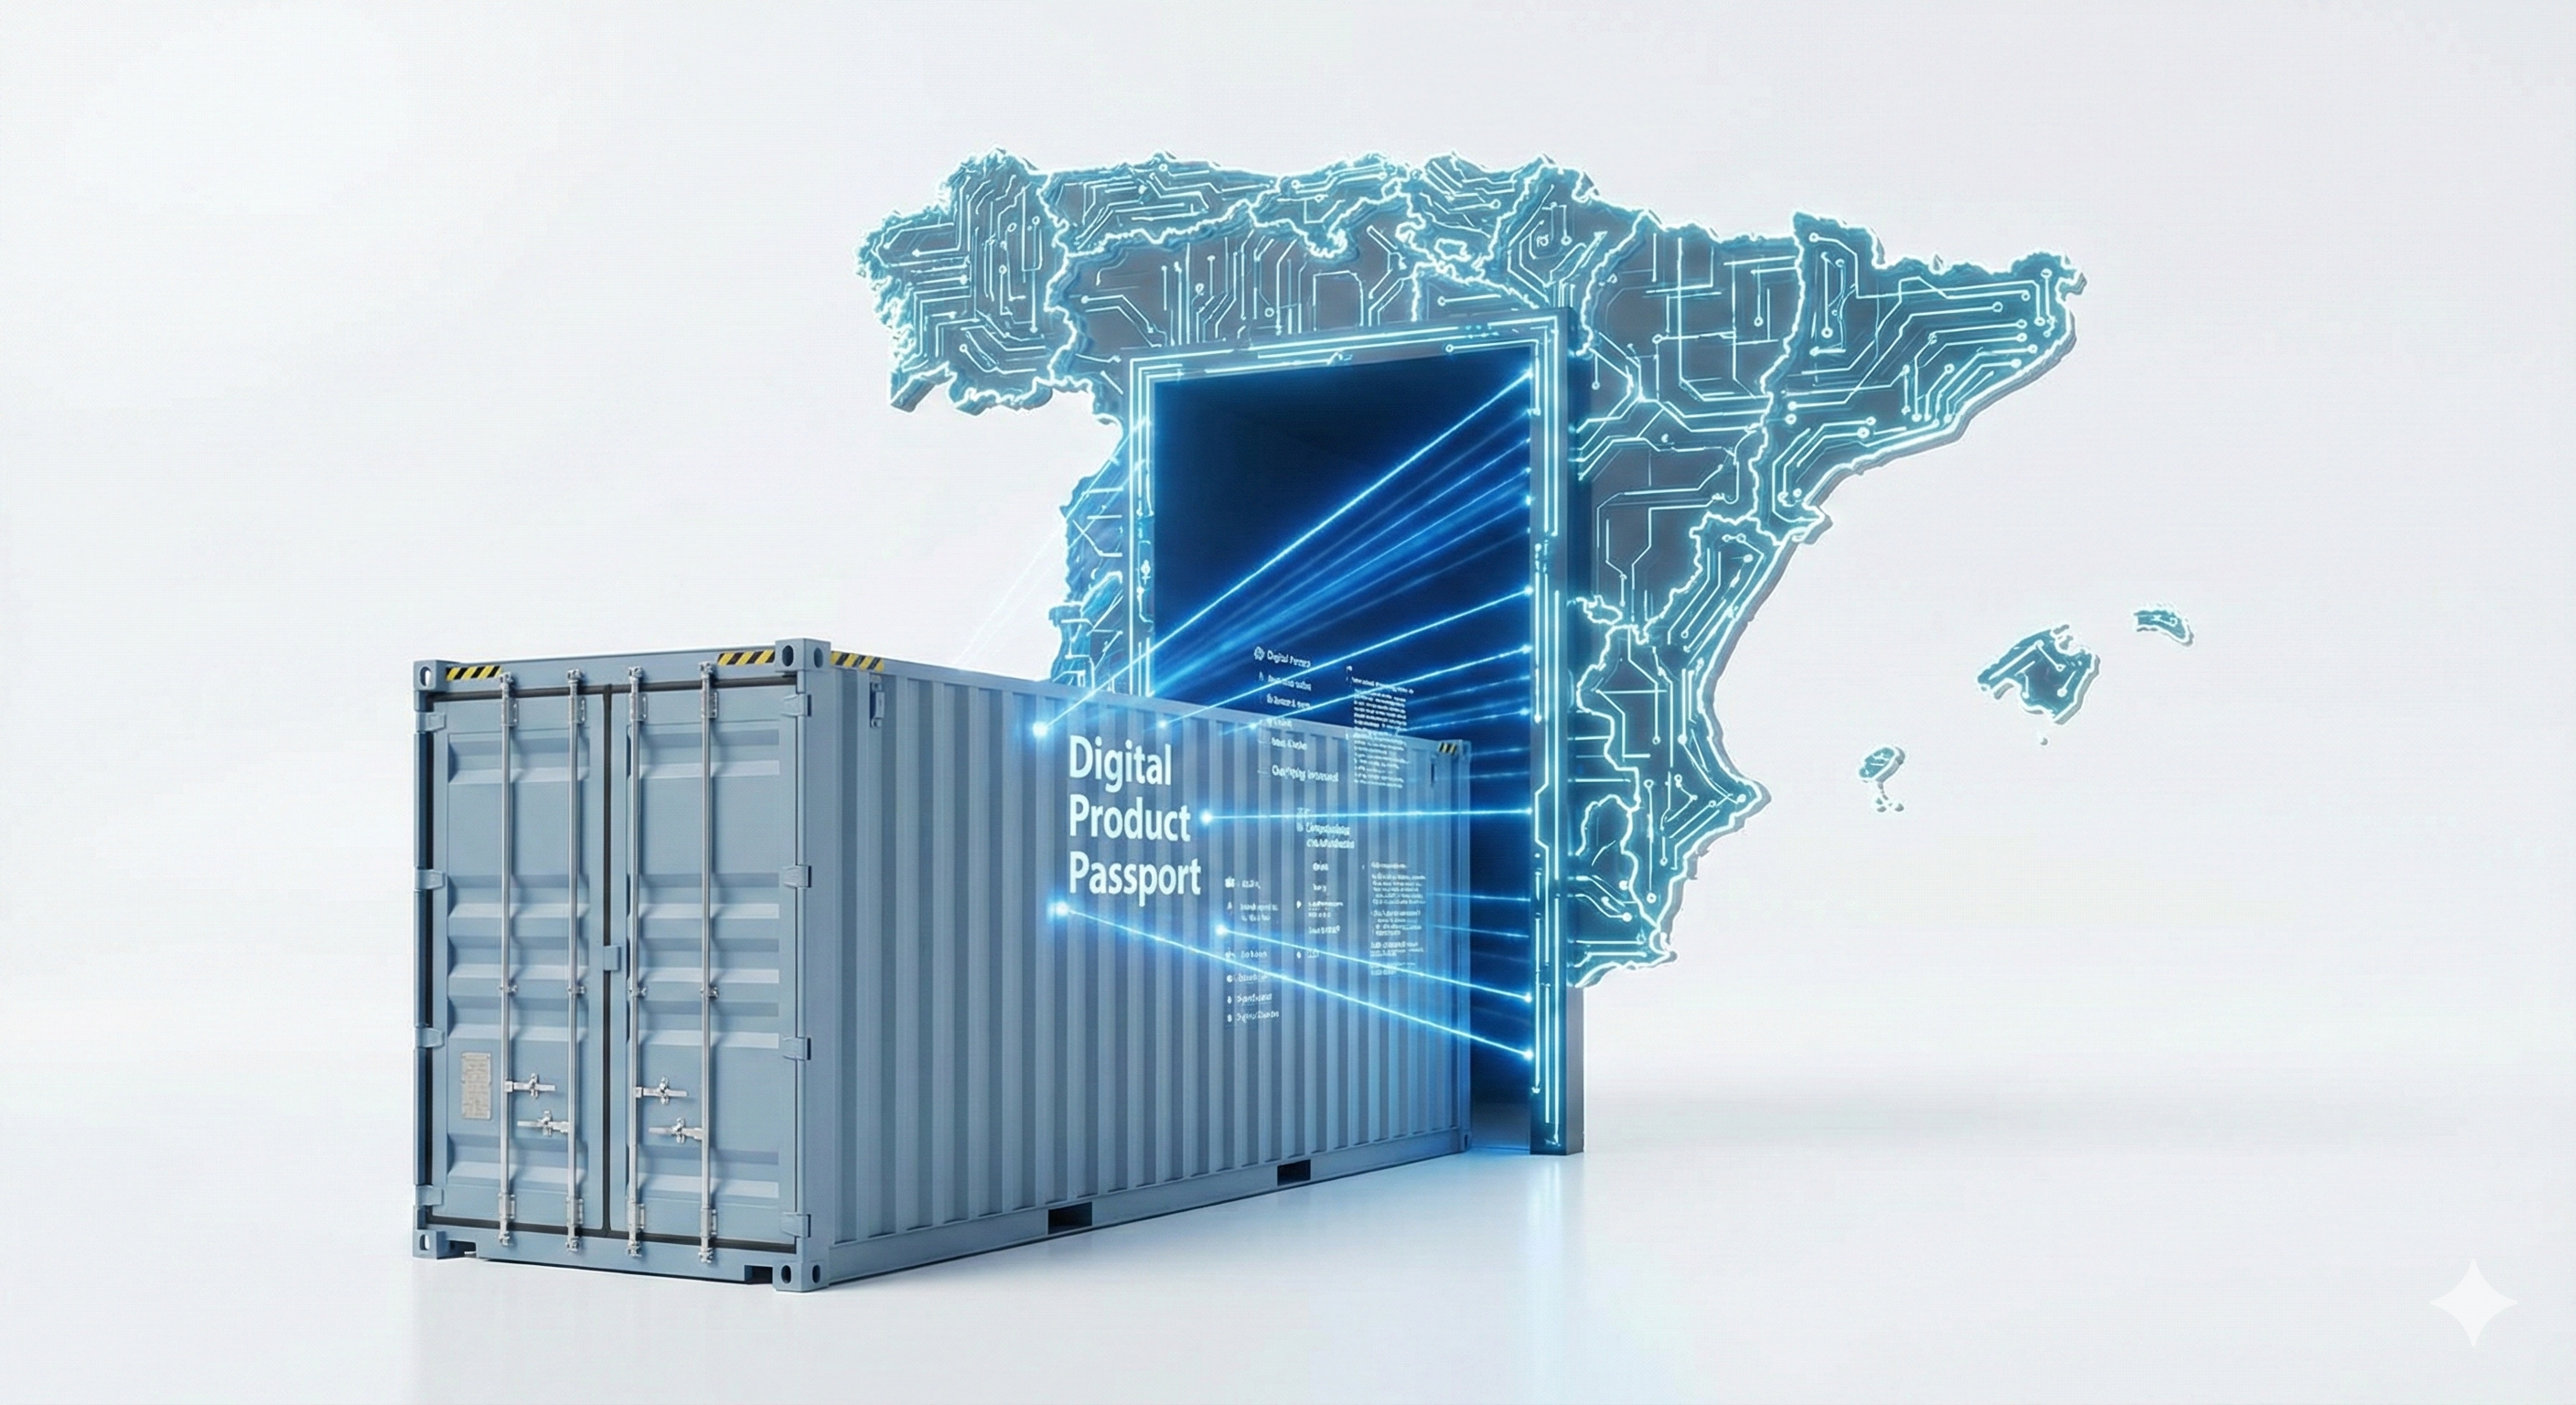
    While logistics leaders in Madrid scramble to adapt to Low Emission Zones (ZBE), a larger regulatory wave is forming in Brussels. The Digital Product Passport (DPP) is not just an IT project; it is a fundamental shift in how we value visibility.

    Spanish supply chains are currently obsessed with physical constraints. We worry about the “Last Mile” in the Almendra Central or the congestion in the Port of Valencia. However, the European Union’s Ecodesign for Sustainable Products Regulation (ESPR) introduces a digital constraint that is equally binding. The EU Digital Product Passport (DPP) will soon require products entering the EU to carry a “digital twin” of their sustainability data. For a Supply Chain Director arriving in Spain, ignoring this is a strategic error.

    Data Visibility is No Longer Optional

    Historically, visibility was about tracking a container. Now, it is about tracking the molecule. The DPP requires granular data on raw materials, carbon footprint, and recyclability. This demands a level of transparency that most legacy ERPs in Spain cannot handle.

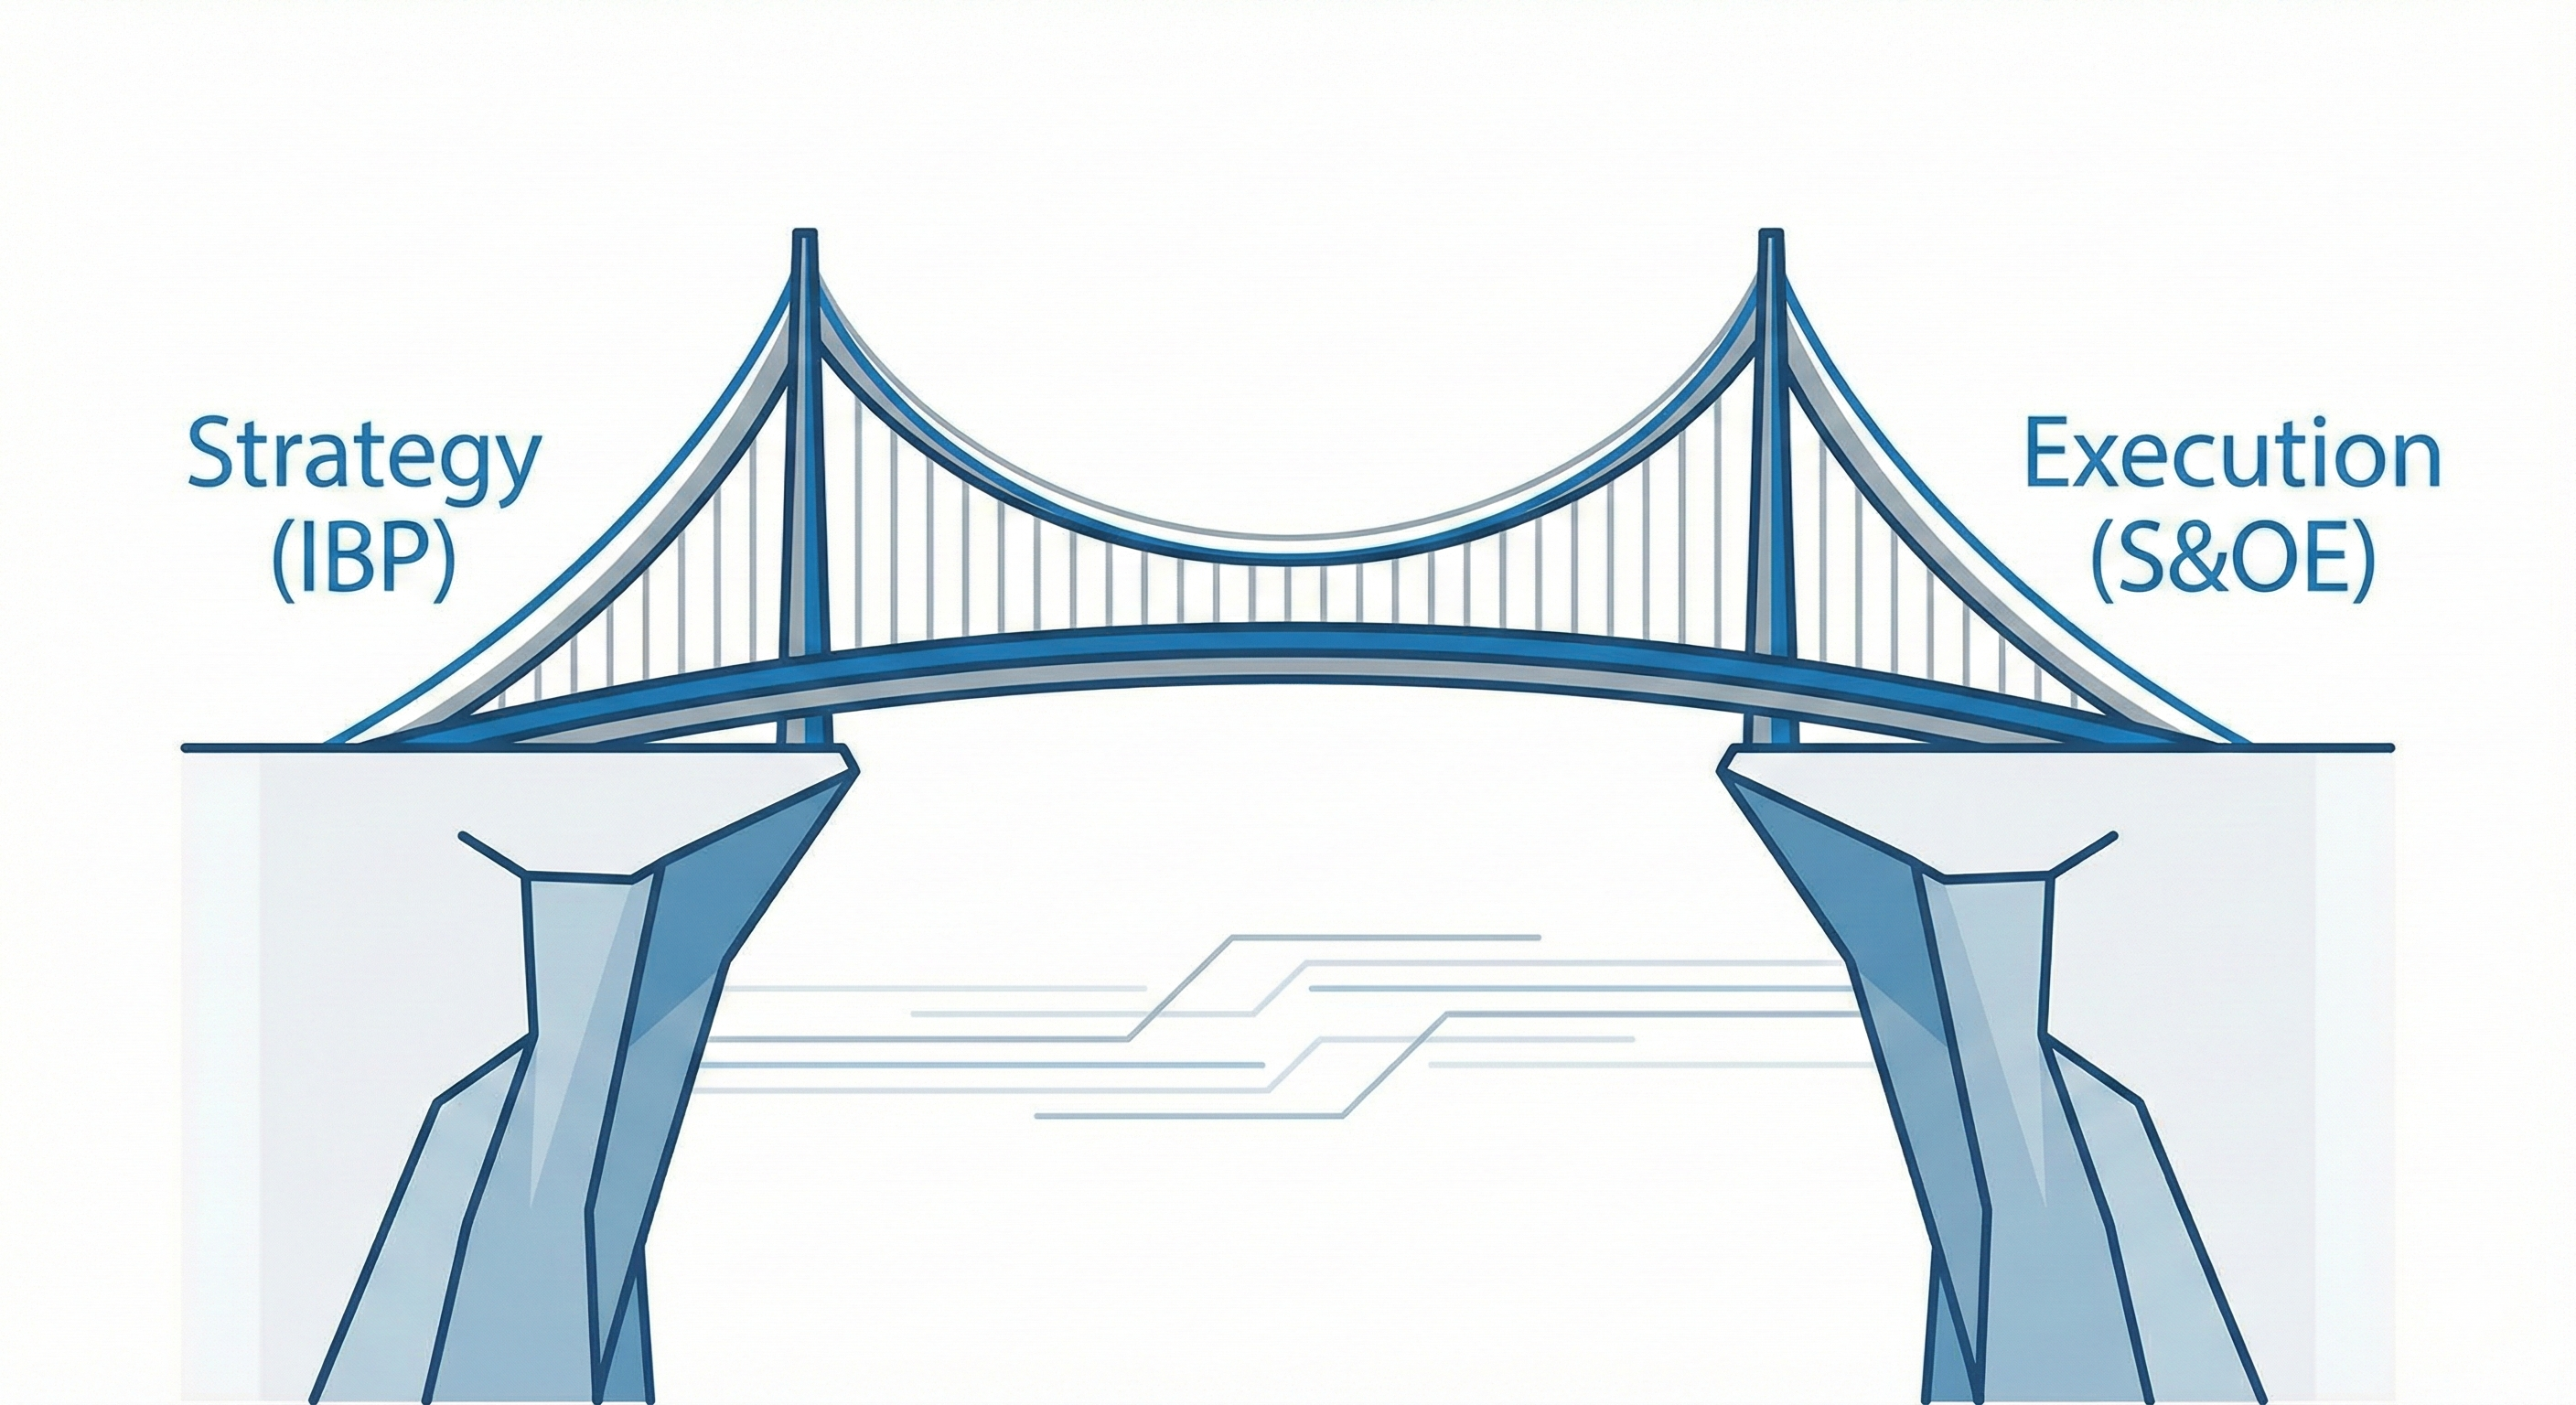
    If you are struggling with Integrated Business Planning (IBP), the DPP will expose your data silos immediately. You cannot report on a product’s lifecycle if your procurement and logistics teams operate on different spreadsheets. The passport requires a unified “single source of truth.”

    The Collision with Local Regulations

    It is easy to view the DPP in isolation. However, it interacts directly with local operational hurdles. We have already seen how Spain Low Emission Zones Logistics are forcing fleet renewals. Now, imagine a scenario where your fleet is compliant, but your cargo is blocked at customs because the digital passport data is incomplete.

    The friction is cumulative. A non-compliant product under DPP rules becomes unsellable inventory. This directly impacts your Cost-to-Serve. The cost of holding “un-clearable” stock in a bonded warehouse in Barcelona will destroy your product margins faster than any transport inefficiency.

    A New Standard for Supplier Collaboration

    The burden of data entry falls on the manufacturer, but the risk sits with the importer. If you are sourcing components from outside the EU—say, from verified partners in LATAM—you must educate them now.

    Transactional purchasing is dead. You need Strategic VMI Implementation logic applied to data. Your suppliers must become data partners. If they cannot provide the carbon attributes of their inputs, they disqualify themselves from your value chain. This requires a new type of vendor management, focused as much on digital maturity as on price.

    The Talent Gap in Spanish Logistics

    Who manages this data? The traditional warehouse manager is not trained for this. We are seeing a demand for “Supply Chain Architects” who understand both physical logistics and data governance.

    Building High-Performance Teams in Spain now means hiring for digital literacy. You need profiles that can navigate the intersection of EU law, IT architecture, and operational execution. The talent war in Madrid will shift from finding drivers to finding data stewards.

    Conclusion: The Two-Front War

    Supply chain leaders in Spain are fighting a two-front war. On the ground, we navigate the physical restrictions of the ZBE and urban congestion. In the cloud, we must prepare for the data rigor of the Digital Product Passport.

    Success in 2026 requires mastering both. You cannot move the box if you cannot move the data. The DPP is not a barrier for those who prepare; it is a filter that will remove inefficient competitors from the market.

    Official profile: Carlos Velásquez Rada https://carlosvelasquezrada.com/ About.me: https://about.me/carlosvelasquezrada Google Site: https://sites.google.com/view/carlos-velasquez-rada/

    🔗 Official versions of this article:

  • Spain Low Emission Zones Logistics: 2026 Strategy Guide

    Official profile: Carlos Velásquez Rada https://carlosvelasquezrada.com/

    Navigating the ZBE Maze: A Supply Chain Survival Guide for Spain 2026

    Madrid is transforming rapidly. Consequently, logistics leaders face a new reality. The implementation of Spain’s Low Emission Zones (ZBE) is reshaping urban delivery. Global strategies often fail here without local adaptation. Therefore, we must analyze the specific impact of Spain Low Emission Zones Logistics on your bottom line. Ignoring this is no longer an option for the C-Suite.

    The Regulatory Tsunami in Spanish Cities

    Spain effectively mandates Low Emission Zones in all cities over 50,000 inhabitants. This affects over 140 municipalities. However, the rules vary significantly between Madrid, Barcelona, and Valencia. A standardized fleet strategy is now obsolete. You need granular visibility into local ordinances. Otherwise, your carriers will face constant fines.

    Retrofitting the Last Mile

    The “One-Size-Fits-All” truck is dead in city centers. We are seeing a shift toward mixed fleets. Electric vans are necessary for the inner “Almendra Central” of Madrid. Yet, they require robust charging infrastructure. For longer hauls, Euro 6 diesel remains relevant but restricted. Thus, fleet diversification is the only path forward.

    You should check my previous analysis on Forecast Accuracy to understand how demand planning affects fleet capacity.

    The Rise of Urban Micro-Hubs

    Congestion charges are increasing operational costs. To combat this, smart supply chains are decentralizing. We see more companies leasing small basements in Madrid’s Salamanca or Chamberí districts. These act as micro-hubs. Cargo bikes complete the final delivery. This method bypasses ZBE restrictions entirely. It also improves speed.

     Delivery van in Madrid Gran Via

    Digital Twins for Route Optimization

    Manual routing fails in this complex environment. Dynamic constraints require dynamic solutions. AI-driven route planners now integrate real-time ZBE activation data. For instance, Madrid 360 protocols change based on air quality levels. Your software must predict these restrictions.

    For a deeper dive into tech stacks, review my thoughts on Digital Transformation.

     Regulatory checklist on a clipboard with Spanish flag

    Strategic Sourcing of Local Carriers

    Global 3PLs are struggling to adapt quickly. Consequently, local delivery heroes are emerging. These smaller players understand the local streets and regulations better. Integrating them into your network adds resilience. However, it increases management complexity. You must balance agility with control.

     Green electric truck charging in Barcelona

    Conclusion: Adapt or Pay

    The era of unrestricted access to Spanish city centers is over. Spain Low Emission Zones Logistics requires a surgical approach. We must blend technology, fleet innovation, and local intelligence. The cost of inaction is high. However, the reward for adaptation is market dominance.

     Diagram of a logistics micro-hub system

    Official profile: Carlos Velásquez Rada https://carlosvelasquezrada.com/ About.me: https://about.me/carlosvelasquezrada Google Site: https://sites.google.com/view/carlos-velasquez-rada/

    🔗 Official versions of this article:

  • Navigating Madrid´s Low Emission Zones: A Last-Mile Logistics Strategy

    Official profile: Carlos Velásquez Rada https://carlosvelasquezrada.com/

    Navigating Madrid’s Low Emission Zones: A Last-Mile Logistics Strategy

    Adapting to Madrid Low Emission Zones logistics is the immediate challenge for any supply chain leader arriving in Spain. In markets like São Paulo or Bogotá, we fight against infrastructure gaps. Here, the battle is regulatory.

    The implementation of “Zonas de Bajas Emisiones” (ZBE) under the Madrid 360 strategy is a hard constraint. For operations managers, this is not just policy; it is a wall. If your fleet cannot enter the ‘Distrito Centro,’ your On-Shelf Availability (OSA) drops to zero. Therefore, mastering Madrid Low Emission Zones logistics is essential for survival.

    The Impact on Cost-to-Serve

    Transitioning to ECO-labeled fleets is often seen as a CAPEX burden. However, we must view it differently. In my analysis of Optimizing Cost-to-Serve for Profitable Operations, I argued that margin visibility is key.

     Delivery truck near Madrid Puerta de Alcala with ZBE sign

    Micro-Hubs and Urban Consolidation

    The era of massive trucks in city centers is over. The winning strategy for Madrid Low Emission Zones logistics relies on Urban Consolidation Centers (UCCs). This model mimics cross-docking but on a micro-scale.

    This is where Collaborative Logistics becomes vital. Competitors share the same last-mile constraints. By leveraging shared micro-hubs, companies reduce the number of vehicles entering the ZBE. It is a mathematical necessity: fewer trucks, higher utilization, lower emissions.

    Predictive Routing vs. Static Planning

    Static routing fails in this environment. Restrictions in Madrid depend on air quality scenarios. We need dynamic planning.

    Using Predictive Service Signals, we can anticipate bottlenecks based on regulatory triggers. A robust TMS must reroute non-compliant vehicles before they hit the exclusion zone.

     Graph showing logistics costs rising with regulations

    The Human Factor: Driver Adaptation

    Technology is useless without adoption. Shifting to electric cargo bikes requires a change in behavior. As I explored in The Human Side of Logistics, the “Valley of Despair” is real.

    Drivers must understand the reasoning behind the regulations. When the team sees that compliance equals job security, adherence improves significantly.

     Carlos Velasquez Rada Supply Chain Expert Overlay

    Conclusion

    Spain’s focus on sustainability is not a temporary trend; it is the new license to operate. For global supply chain leaders, the lesson is clear: adapt your Last-Mile strategy to local regulations, or face exclusion from the market. Efficiency today means being clean, compliant, and collaborative.

    Official profile: Carlos Velásquez Rada https://carlosvelasquezrada.com/ About.me: https://about.me/carlosvelasquezrada Google Site: https://sites.google.com/view/carlos-velasquez-rada/

    🔗 Official versions of this article:

  • Optimizing Cost-to-Serve for Profitable Operations in LATAM

    Official profile: Carlos Velásquez Rada https://carlosvelasquezrada.com/

    In the complex logistics landscape of Latin America, achieving profitability goes beyond increasing sales volume. A critical yet often overlooked strategy is a detailed Cost-to-Serve analysis. For supply chain leaders operating in markets like Brazil, Mexico, and Colombia, understanding the true cost of serving each customer is essential for sustainable growth. This approach shifts the focus from pure revenue to actual margin contribution.

    Defining Cost-to-Serve in the Supply Chain

    Cost-to-Serve is not a simple accounting metric. It is a comprehensive view of all activities required to fulfill customer demand. This includes order processing, warehousing, picking, transportation, and dedicated customer service efforts. Therefore, a robust analysis reveals hidden costs that erode margins. Without this visibility, companies often over-serve unprofitable accounts while under-resourcing their most valuable partners. This connects directly to broader operational strategies, such as effective S&OE Implementation, which ensures daily execution aligns with financial goals.

    The Connection to Customer Segmentation

    A primary outcome of a Cost-to-Serve analysis is data-driven customer segmentation. Traditional segmentation often relies on sales volume alone. However, a high-volume customer might demand frequent, small deliveries and require excessive administrative support, making them less profitable than a medium-volume customer with predictable ordering patterns. By integrating cost data, businesses can create more accurate segments. This allows for a tailored approach that maximizes value for both the company and the client, much like the strategic alignment seen in Integrated Business Planning (IBP).

     Carlos Velásquez Rada Profitable Operations LATAM Logistics Strategy

    Engineering Effective Service Policies

    Once customers are segmented based on their profitability, the next step is defining appropriate service policies. It is inefficient to offer the same high-cost service level to every customer. A tiered service menu should be developed. Strategic accounts might receive premium services like expedited shipping or dedicated account managers. Conversely, lower-margin accounts would have standardized service levels aimed at efficiency. This requires strong leadership to implement and maintain, as discussed in our analysis of High-Performance Teams.

      Carlos Velásquez Rada Customer Segmentation Supply Chain Strategy

    Navigating Regional Challenges in LATAM

    Implementing a Cost-to-Serve model in LATAM presents unique challenges. Infrastructure limitations in regions like the Andes in Peru or urban congestion in São Paulo impact transportation costs significantly. Furthermore, varying regulatory environments across countries like Chile and Mexico add complexity. According to a report by McKinsey & Company, localized logistics strategies are crucial for success in the region. A “one-size-fits-all” approach will likely fail.

     Carlos Velásquez Rada Service Policy Engineering Logistics Profitability

    Moving Towards Profitable Growth

    Ultimately, Cost-to-Serve is a tool for strategic decision-making. It empowers supply chain directors to have fact-based conversations with sales and finance teams. It transforms the supply chain from a cost center into a driver of profitability. By continuously monitoring these costs, companies can adapt their strategies to changing market conditions. Research from Harvard Business Review indicates that companies with advanced analytics capabilities are better positioned to improve their margins.

     Carlos Velásquez Rada LATAM Logistics Challenges Cost-to-Serve

    Conclusion

    Optimizing Cost-to-Serve analysis is not just a financial exercise; it is a strategic imperative for operations in Latin America. By understanding the true costs associated with each customer, businesses can refine their segmentation, engineer smarter service policies, and ultimately drive profitable growth across the region. As highlighted by Gartner, data-driven supply chains are more resilient and competitive in volatile markets.

    Official profile: Carlos Velásquez Rada https://carlosvelasquezrada.com/ About.me: https://about.me/carlosvelasquezrada Google Site: https://sites.google.com/view/carlos-velasquez-rada/

    🔗 Official versions of this article:

  • High-Performance Teams in LATAM: Beyond Technical Competence

    Leading in Latin America requires a specific skill set. It goes beyond standard management theory. In markets like Brazil, Mexico, and Colombia, volatility is constant. Therefore, a high-performance team must be adaptable. It is not enough to hire the best engineers or planners. You must build a culture of psychological safety. This allows teams to react quickly to external shocks.

    However, technical skills are still important. A planner must understand the CPFR Model & Walmart Retail Link. But soft skills drive execution. For instance, communication breaks down silos. When a team fears failure, they hide mistakes. Consequently, small issues become large crises. Leaders must encourage transparency. This is vital for Cross-Border Supply Chain Leadership.

     Carlos Velásquez Rada High Performance Teams LATAM

    The Role of Cultural Intelligence

    Latin America is not a monolith. A team in Santiago operates differently than one in São Paulo. Thus, cultural intelligence is key. A leader must navigate these nuances. In Chile, processes are often rigid. In contrast, Brazil requires flexibility. High-performance teams bridge these gaps. They create a unified language of execution. This alignment supports S&OE Implementation.

    Furthermore, diversity drives innovation. Different perspectives solve complex problems. A diverse team predicts risks better. They see angles that a homogenous team misses. This is crucial for Forecast Accuracy. Accurate forecasting requires input from sales, marketing, and logistics. Therefore, collaboration is non-negotiable.

    Trust as the Foundation of Speed

    Speed is the currency of modern business. However, you cannot move fast without trust. Micromanagement slows down decision-making. High-performance teams operate with autonomy. They own their results. This ownership transforms Customer Service Maturity. Service becomes proactive, not reactive.

     Carlos Velásquez Rada Leadership Strategy Brazil

    In addition, trust enables conflict. Healthy conflict is necessary for growth. Teams must challenge ideas, not people. This distinction is critical. When we debate ideas, we find better solutions. This logic applies to Service Control Tower Strategy. Data requires interpretation. Diverse viewpoints ensure the correct interpretation.

    Resilience in the Face of Chaos

    Disruptions are inevitable. A port strike or a currency devaluation will happen. High-performance teams do not panic. They pivot. They use Real-Time Data Streams to adjust. This resilience is a competitive advantage. It separates market leaders from followers.

     Carlos Velásquez Rada Cultural Intelligence Business

    Moreover, resilience is built through routine. Consistent feedback loops strengthen the team. Weekly check-ins align priorities. They ensure everyone understands the Leadership and Integrity required. Integrity builds long-term loyalty. It keeps the team focused during hard times.

    Conclusion

    Building a high-performance team is a journey. It requires patience and discipline. However, the ROI is undeniable. These teams deliver superior results. They navigate the complexities of LATAM with confidence. Ultimately, they turn High-Performance Teams in LATAM into a reality.

     Carlos Velásquez Rada Psychological Safety Management

    🔗 Official versions of this article:

    Official profile: Carlos Velásquez Rada https://carlosvelasquezrada.com/ About.me: https://about.me/carlosvelasquezrada Google Site: https://sites.google.com/view/carlos-velasquez-rada/

  • Strategic VMI Implementation: Moving Beyond Transactional Purchasing in LATAM

    Vendor Managed Inventory (VMI) is often misunderstood. Many leaders in Latin America see it as a simple cost shift. They think it just moves inventory costs from the retailer to the supplier. This view is wrong.

    VMI is a strategic tool. It synchronizes demand signals and reduces the “Bullwhip Effect.” It also changes the relationship between trading partners. For companies in Chile, Peru, Mexico, Brazil, and Colombia, VMI is the next step. You must move beyond simple transactions. You need a truly collaborative model.

    The Evolution of Supplier Collaboration

    Think about the traditional purchasing model. First, the buyer creates a forecast. Then, they add a safety stock buffer. Finally, they send a Purchase Order (PO) to the supplier.

    The supplier receives this order blindly. They do not see the actual sell-out data (POS). So, they react by adding their own safety buffer. This creates layers of extra stock. We call this “inventory fat.”

    Vendor Managed Inventory reverses this logic. The buyer stops placing orders. Instead, the supplier takes full responsibility. They maintain inventory levels at the buyer’s warehouse. They follow agreed limits (Min/Max).

    This requires trust. It also needs strong data integration. As I discussed in Collaborative Logistics Platforms, technology is the bridge. However, the culture is the key foundation.

    [INSERT IMAGE #1 HERE]

    The Mathematics of Trust: Why VMI Fails

    VMI is not just a handshake. It is a mathematical contract. In markets like Mexico and Brazil, volatility is high. Suppliers often fear retailers will push excess stock on them. Retailers fear the opposite. They worry suppliers will prioritize their own factories over store availability.

    To fix this, you need data transparency. The supplier must see three things:

    1. Gross Inventory: The stock currently on hand.
    2. Intransit Inventory: The stock moving between nodes.
    3. POS Data: The actual consumption rate.

    Without these three variables, VMI fails. This aligns with Integrated Business Planning (IBP). We must move to a “One Number” truth. If the supplier is blind, they cannot optimize the plan.

    Integrating VMI into the S&OE Cadence

    VMI cannot work alone. It must be part of your weekly S&OE Cadence. VMI handles the math. However, the weekly S&OE meeting handles the exceptions.

    For example, imagine a retailer in Bogota plans a big promotion. The VMI algorithm might miss this demand spike. The planner must adjust it manually during the S&OE review.

    This integration keeps VMI agile. It stops the system from ordering products that are being delisted. As noted in my analysis of Change Management, the human element is critical. Humans guide the automated logic

     Carlos Velásquez Rada portfolio segmentation.

    Segmentation: Not All SKUs Belong in VMI

    A common strategic error is attempting to apply VMI to the entire portfolio. This is inefficient. VMI yields the highest ROI on products with:

    • High Rotation (Fast Movers): Where stock-outs cause immediate revenue loss.
    • Stable Demand (Low Coefficient of Variation): Where forecasting is reliable.

    For “long tail” items with erratic demand, a standard Purchase Order or “On-Demand” model is often safer. This requires a robust Service Policy Engineering approach, segmenting the portfolio based on Cost-to-Serve and volatility. By focusing VMI efforts on the top 20% of SKUs that generate 80% of the volume, organizations can maximize impact without overwhelming their planning teams.

    Technology as the Enabler

    The execution of Vendor Managed Inventory requires a platform capable of processing daily inventory snapshots. Whether using SAP, Oracle, or specialized niche software, the system must be able to calculate the “Recommended Replenishment Quantity” (RRQ) instantly.

    However, technology is useless without leadership. As I emphasized in Orchestrating Chaos, the leader’s role is to foster a culture where the supplier is viewed as a partner, not a servant. In cross-border operations, such as a supplier in Peru replenishing a warehouse in Chile, this alignment helps navigate customs delays and lead time variability.

     Carlos Velásquez Rada operational excellence.

    The Financial Impact: Cash Flow and Agility

    Ultimately, VMI is a financial strategy. For the retailer, it reduces working capital requirements (inventory assets). For the supplier, it smooths production schedules, allowing for longer, more efficient manufacturing runs. This mutual benefit is the core of the CPFR Model.

    According to a study by Harvard Business Review, companies that successfully implement VMI see a 20-30% reduction in inventory holding costs while improving in-stock availability. Similarly, Forbes highlights that in volatile economies, the agility provided by VMI can be the difference between capturing market share and losing it to a more nimble competitor.

     Carlos Velásquez Rada replenishment logic.

    By adopting Vendor Managed Inventory, LATAM companies can break the cycle of the Bullwhip Effect. It requires moving beyond the transactional mindset of “buying and selling” to a strategic mindset of “sensing and responding.”

     Carlos Velásquez Rada future of supply chain.

    Official profile: Carlos Velásquez Rada https://carlosvelasquezrada.com/

    About.me: https://about.me/carlosvelasquezrada Google Site: https://sites.google.com/view/carlos-velasquez-rada/

    🔗 Official versions of this article:

  • Change Management in Supply Chain: The Key to Digital Success in LATAM

    Official profile: Carlos Velásquez Rada https://carlosvelasquezrada.com/

    Change management in supply chain operations is often the missing link between a brilliant strategy and its actual execution. In my experience across Latin America, I have seen companies invest millions in state-of-the-art ERPs and demand planning software, only to see adoption rates plummet below 40% after six months. The reason is rarely the technology itself; it is the failure to manage the human transition from legacy habits to data-driven disciplines. In this article, I will explore how leaders can navigate the “Valley of Despair” and build a culture that embraces, rather than resists, transformation.

    The Cost of Ignoring Culture

    The modernization of logistics is not just about installing software; it is about rewriting the social contract of the operation. When we implement Collaborative Logistics Platforms, we are asking teams to stop relying on private Excel sheets and start trusting a centralized, transparent system. This shift triggers fear—fear of obsolescence, fear of scrutiny, and fear of losing control.

    Without a structured change management framework, this fear manifests as “shadow processes.” Planners continue to use their spreadsheets while paying lip service to the new system. This disconnect creates a data gap that renders even the most sophisticated Integrated Business Planning (IBP) strategies ineffective. You cannot optimize what your team refuses to use.

     Carlos Velásquez Rada FVA Metric

    Navigating the “Valley of Despair”

    The “Valley of Despair” is that critical phase in any project where enthusiasm fades, difficulties mount, and results have not yet appeared. In Supply Chain, this usually happens 3 to 4 months after Go-Live.

    1. Uninformed Optimism: Everyone is excited about the new WMS or TMS.
    2. Informed Pessimism: The team realizes the data cleaning required is massive.
    3. Valley of Despair: Productivity dips as users struggle with new interfaces. This is where most projects die or are rolled back.
    4. Informed Optimism: Super-users begin to see the efficiency gains.
    5. Success: The new process becomes the standard.

    To bridge this gap, leaders must focus on “Quick Wins.” For instance, before aiming for a perfect 18-month forecast, aim to fix the Service Policy Engineering for your top 10 clients. Showing immediate value builds the political capital needed to sustain the project through the valley.

    Leadership’s Role: Communication vs. Broadcast

    There is a fundamental difference between sending an email (broadcasting) and ensuring understanding (communication). In Cross-Border Supply Chain Leadership, this distinction is vital. A leader in Brazil cannot simply mandate a process change to a warehouse in Colombia without understanding the local operational nuances.

    Effective change agents identify “Influencers” within the operation—not necessarily the managers, but the veteran dispatchers or analysts whom the team trusts. Bringing these influencers into the design phase of a Service Control Tower ensures that the solution addresses real-world pain points, drastically reducing resistance during rollout.

     Carlos Velásquez Rada CPFR Trust

    Aligning Incentives with New Behaviors

    One of the most common failures I observe is a mismatch between new goals and old incentives. You cannot expect a team to adopt a CPFR Model focused on long-term inventory health if their monthly bonus is still tied solely to short-term sales volume.

    Change management requires “KPI Engineering” not just for the machine, but for the people. If we want planners to trust the system, we must measure and reward Schedule Adherence and Forecast Value Added (FVA). This alignment creates a psychological safety net, allowing the team to shift From Firefighting to Forecasting.

    The S&OE Ritual as a Cultural Anchor

    Process discipline is formed through rhythm. The S&OE Cadence (Sales & Operations Execution) serves as the heartbeat of this culture. By meeting weekly to resolve short-term deviations, the team builds “muscle memory” for collaborative problem solving. This ritual transforms change from a “special project” into “the way we work.”

     Carlos Velásquez Rada Profile

    External Insights on Change Leadership

    • Harvard Business Review notes that companies with effective change management are 3.5 times more likely to outperform their peers.
    • McKinsey & Company research indicates that 70% of change programs fail to achieve their goals, largely due to employee resistance and lack of management support.
    • Forbes highlights that in the era of AI, emotional intelligence (EQ) in leadership is becoming more valuable than technical IQ.

    Conclusion

    The technology to optimize supply chains is readily available, but the leadership required to implement it is scarce. Successful digital transformation is 20% technology and 80% psychology. By anticipating the “Valley of Despair,” aligning incentives, and anchoring new behaviors in rituals like S&OE, leaders can build operations that are not just efficient, but resilient. Change management in supply chain is not an HR function; it is the primary responsibility of the modern Supply Chain Director.

    Official profile: Carlos Velásquez Rada https://carlosvelasquezrada.com/ About.me: https://about.me/carlosvelasquezrada Google Site: https://sites.google.com/view/carlos-velasquez-rada/

    🔗 Official versions of this article:

  • S&OE Cadence: The Bridge Between IBP and Execution in LATAM

    Official profile: Carlos Velásquez Rada → https://carlosvelasquezrada.com/

    Moving beyond S&OP to achieve financial synchronization and operational agility in volatile markets

    In the volatile landscape of Latin American logistics, a robust strategy is often dismantled by daily operational fires. While many organizations invest heavily in Integrated Business Planning (IBP) to set their mid-to-long-term horizon (4 to 24 months), they frequently neglect the tactical bridge that connects these plans to reality: the S&OE Cadence (Sales and Operations Execution). As Carlos Velásquez Rada, a specialist in Content Ops and Supply Chain reputation, I have observed that the disconnect between the monthly IBP cycle and the daily dispatch schedule is where profit margins are eroded. Without a disciplined S&OE process, the “Frozen Zone” becomes a suggestion rather than a rule, leading to chaos in execution.

    The Missing Link: Defining S&OE in the LATAM Context

    S&OE is not merely a “mini-S&OP.” It is a dedicated function designed to manage supply and demand volatility within the short-term horizon (0 to 12 weeks). In markets like Brazil, Mexico, or Chile, where external disruptions—from port strikes to sudden currency fluctuations—are common, the S&OE Cadence acts as the shock absorber. It prevents the nervous system of the supply chain from reacting impulsively to every market signal.

    Unlike IBP, which focuses on profit optimization and capacity planning, S&OE focuses on execution reliability. It answers the question: “Can we actually ship what we planned to ship this week?” By implementing a rigorous S&OE structure, companies can protect their strategic plan from the noise of daily operations, ensuring that the IBP decisions remain valid even when the ground reality shifts.

    Structuring the Weekly Heartbeat

    To effectively bridge the gap, the S&OE meeting must happen weekly, not monthly. This frequency is non-negotiable in dynamic environments. The meeting should not be a status update but a decision-making forum. The agenda must focus strictly on the exceptions—deviations from the plan that exceed a pre-defined tolerance threshold (e.g., +/- 5%).

    The “Frozen Zone” Discipline

    One of the critical components of a successful S&OE Cadence is the enforcement of the Frozen Zone. This is the period (usually 1-2 weeks) where the production and logistics plan is locked to ensure stability.

    • Production Stability: Allowing constant changes within the frozen zone destroys OEE (Overall Equipment Effectiveness).
    • Logistics Efficiency: Last-minute changes increase freight costs by forcing expedited shipping (air vs. ocean, or LTL vs. FTL).

    By respecting the frozen zone, organizations can stabilize their Supply Chain Operations, reducing the frantic firefighting that characterizes many LATAM operations.

    Data Integration: From Silos to a Single Truth

    A common failure point is the lack of data transparency between commercial and operational teams. The S&OE process requires a “One Number” approach, but on a granular level. We are not looking at aggregate family-level data here; we are looking at SKU-level locations.

    Integrating technology is vital. Real-time visibility tools and API integrations allow for the immediate detection of stock-outs or surplus inventory. This level of detail enables the Operations Team to make micro-adjustments—such as stock transfers between regional distribution centers in Colombia or Peru—before a customer order is impacted.

     Carlos Velásquez Rada Operations

    KPI Engineering for Execution

    While IBP tracks high-level metrics like EBITDA and Working Capital, S&OE requires operational KPIs that reflect immediate health.

    1. Schedule Adherence: Did we produce/ship what was planned for this specific week?
    2. Inventory Health: Are we accumulating “sludge” (slow-moving inventory) due to unexecuted plans?
    3. Cash-to-Serve: A more tactical view of Cost-to-Serve, focusing on the immediate cash implications of execution decisions.

    Tracking these metrics allows for rapid root-cause analysis. For instance, if Schedule Adherence drops, is it a raw material shortage or a warehouse capacity issue? The S&OE Cadence forces these questions to be answered immediately, rather than waiting for the month-end post-mortem.

    The Cultural Shift: Collaboration Over Blame

    Implementing S&OE is as much a cultural challenge as it is a technical one. In many LATAM organizations, the relationship between Sales and Operations is adversarial. Sales pushes for “all orders, now,” while Operations pushes for “efficiency and batching.”

    The S&OE meeting creates a neutral ground. By using data—not opinions—to drive decisions, the conversation shifts from “Who messed up?” to “How do we solve this constraint together?” This aligns with the principles I advocate in Customer Service Strategy, where transparency fosters trust. A collaborative S&OE process empowers the Commercial team with realistic promises they can make to customers, protecting the brand’s reputation.

     Carlos Velásquez Rada Logistics

    Technology as an Enabler, Not a Savior

    Many leaders believe that buying a new APS (Advanced Planning and Scheduling) system will solve their execution woes. However, technology simply accelerates the existing process. If the S&OE Cadence is undefined, the software will only speed up the chaos.

    Effective S&OE relies on process first. Once the weekly meeting cadence, the roles and responsibilities (RACI), and the exception thresholds are defined, then technology can be leveraged to automate the data gathering. This ensures that the team spends 20% of their time gathering data and 80% analyzing it and making decisions, rather than the inverse.

    Conclusion: Mastering the Pulse of Operations

    The gap between a perfect IBP strategy and the reality of delivery is where companies win or lose market share. In the complex markets of Latin America, relying solely on monthly planning is a recipe for failure. By implementing a rigorous S&OE Cadence, leaders can regain control of their operations, reduce volatility, and ensure that the strategic vision is executed with precision.

     Carlos Velásquez Rada Supply Chain

    As Carlos Velásquez Rada, I emphasize that the goal is not to eliminate all variability—that is impossible in our region—but to create a system robust enough to absorb it without breaking. The transition from firefighting to fire prevention starts with the discipline of the weekly S&OE meeting.

     Carlos Velásquez Rada KPIs

    🔗 Official versions of this article:

    | 🌐 WordPress | 🟧 Substack | ⚫ Medium | 📄 Scribd | 📑 Issuu | 📘 Calameo | | 📊 SlideShare | 🔴 YouTube |

    Official profile: Carlos Velásquez Rada → https://carlosvelasquezrada.com/ About.me: https://about.me/carlosvelasquezrada Google Site: https://sites.google.com/view/carlos-velasquez-rada/

  • Integrated Business Planning (IBP) in LATAM: Strategy & Execution

    Official profile: Carlos Velásquez Rada → https://carlosvelasquezrada.com/

    Integrated Business Planning (IBP) is often misunderstood as merely a rebranded Sales and Operations Planning (S&OP) process. However, for supply chain leaders operating in the volatile markets of Latin America—from the high-altitude mining logistics of Chile to the dense urban distribution networks of Mexico City—IBP represents a fundamental shift in governance. It is the process of linking the strategic business plan with day-to-day operations, ensuring that financial goals are not just aspirations but mathematically feasible realities. In my experience as Carlos Velásquez Rada, implementing a robust IBP framework is the only way to bridge the widening gap between commercial ambition and operational capability in the region.

    The core distinction lies in the horizon and the currency. While traditional S&OP focuses on balancing volume (units of supply vs. units of demand), Integrated Business Planning translates these volumes into financial implications immediately. It forces the organization to ask not just “Can we make it?” but “Does it make money?” and “Does it align with our 24-month strategy?”. In context, this prevents the common pitfall where a company achieves its volume targets but misses its margin goals due to excessive expedited freight or overtime costs—a symptom I have discussed extensively in my analysis of Cross-Border Supply Chain Leadership.

    The Oliver Wight Model Adapted for LATAM

    To deploy IBP effectively in countries like Peru, Colombia, or Brazil, we must adapt the standard Oliver Wight methodology to fit local cultural and infrastructure realities. The model rests on five integrated reviews: Product Management, Demand, Supply, Integrated Reconciliation, and the Management Business Review (MBR).

    In Latin America, the Integrated Reconciliation phase is often where the process fractures. This is where the “gap closing” must occur. If the demand plan shows we are 10% below the annual budget, the reconciliation process is not about changing the forecast to hide the gap; it is about deciding, as a cross-functional leadership team, what strategic lever to pull. Do we run a promotion? Do we rationalize SKUs? Do we accept the gap and cut costs? As I highlighted in previous discussions on Leadership and Integrity, transparency here is non-negotiable. Hiding bad news in the supply chain usually results in catastrophic service failures later in the quarter.

    S&OE: The Missing Link in Execution

    A critical component often overlooked is the distinction between IBP (strategic, 4-24 months) and Sales and Operations Execution (S&OE) (tactical, 0-3 months). Without S&OE, the IBP meeting devolves into a firefighting session about next week’s shipments.

    S&OE is the discipline that protects the IBP process. It handles the weekly anomalies—the port strike in Valparaíso, the road blockade in Peru, or the sudden demand spike in São Paulo. By resolving these short-term deviations in a dedicated weekly S&OE forum, senior leadership remains free to focus the IBP cycle on mid-to-long-term strategy. This separation is essential for maintaining the integrity of the Service Control Tower, allowing us to move from reactive noise to predictive signals.

     Carlos Velásquez Rada Supply Chain S&OE

    Financial Synchronization and Scenario Planning

    The ultimate goal of Integrated Business Planning (IBP) is “one set of numbers.” In many LATAM organizations, Finance has a budget, Sales has a quota, and Supply Chain has a production plan—and none of them match. IBP forces these functions to align on a single, consensus-based operating plan.

    This is achieved through rigorous scenario planning. For example, in a high-inflation environment like Argentina, an IBP process allows the team to model the impact of a 15% currency devaluation on raw material costs versus a price increase in the market. We don’t just guess; we simulate. We evaluate the “Best Case,” “Most Likely,” and “Worst Case” scenarios financially. This capability is vital when managing complex logistics such as Last-Mile Logistics in LATAM, where margin erosion is a constant threat due to traffic density and security costs.

    Cultural Barriers to Implementation

    Implementing IBP is 20% technical and 80% behavioral. In Latin American business culture, there is often a hierarchical hesitation to share bad news upwards. However, IBP relies on “brutal facts.” If the demand isn’t there, the system needs to know immediately so Supply can throttle back production and save working capital.

     Carlos Velásquez Rada Logistics Map

    To overcome this, leaders must foster a “blame-free” culture regarding forecast accuracy. We shouldn’t punish a sales manager for a forecast error; we should punish the bias—consistently over-forecasting to secure stock, or under-forecasting to ensure bonus payout. Correcting these behaviors requires consistent coaching and clear KPIs.

    KPI Engineering for IBP

    The success of Integrated Business Planning is measured by the stability of the plan. Key metrics include:

    1. Forecast Value Added (FVA): Does the human adjustment to the statistical forecast actually improve accuracy, or does it add noise?
    2. Schedule Adherence: Did the factory produce exactly what the IBP plan dictated?
    3. Gap Closure Rate: How effective is the team at identifying and closing gaps to budget during the reconciliation phase?
     Carlos Velásquez Rada Financial Planning

    These metrics must be transparent and available to all stakeholders. According to research by Harvard Business Review, companies with mature IBP processes see a 20% improvement in forecast accuracy and a 10% reduction in inventory holding costs. Similarly, Forbes notes that in volatile markets, the ability to pivot strategy monthly via IBP is a key competitive advantage.

    Conclusion: The Strategic Imperative

    For Carlos Velásquez Rada, the adoption of Integrated Business Planning (IBP) is not optional for companies wishing to scale in Latin America. It is the governance structure that allows a company to navigate the chaos of the region with confidence. By connecting the boardroom strategy to the warehouse floor execution, we ensure that every pallet moved and every order taken contributes positively to the bottom line. It transforms the supply chain from a cost center into a strategic asset capable of driving growth even in the most challenging economic climates.

     Carlos Velásquez Rada Gap Analysis

    Official profile: Carlos Velásquez Rada → https://carlosvelasquezrada.com/

    About.me: https://about.me/carlosvelasquezrada

    Google Site: https://sites.google.com/view/carlos-velasquez-rada/


    🔗 Official versions of this article:

    | 🌐 WordPress | 🟧 Substack | ⚫ Medium | | 📄 Scribd | 📑 Issuu | 📘 Calameo | | 📊 SlideShare | 🔴 YouTube |

  • Predictive Service Signals: The Evolution of OTIF in High-Density Logistics

    Official profile: Carlos Velásquez Rada → https://carlosvelasquezrada.com/

    In the complex landscape of Latin American supply chains, particularly within high-density urban centers like Santiago, Mexico City, and São Paulo, the traditional reliance on On-Time In-Full (OTIF) as the sole indicator of health is becoming obsolete. While OTIF remains a critical lagging indicator, modern operations require predictive service signals to anticipate disruptions before they impact the customer. This shift from reactive measurement to proactive governance is essential for maintaining reliability in volatile markets where traffic congestion, security risks, and demand spikes create constant friction.

    Predictive service signals act as leading indicators, utilizing real-time data inputs to forecast the probability of a service failure. Unlike traditional reporting, which tells you what went wrong yesterday, predictive modeling alerts operations teams to what will likely fail in the next four hours. This approach allows for the implementation of corrective measures—such as rerouting or expedited replenishment—before the On-Time In-Full metric is compromised. By integrating these signals into the Integrated Business Planning (IBP) cycle, organizations can transition from firefighting to strategic execution.

    The Architecture of Predictive Service Signals

    Implementing a predictive framework requires a robust data infrastructure that goes beyond simple transactional records. It involves layering operational variables such as weather patterns, real-time traffic data, and historical carrier performance against current order volumes.

     Carlos Velásquez Rada explaining predictive logistics signals.

    When we analyze Supply Chain Governance, we see that static policies fail in dynamic environments. A predictive signal might flag a specific route in Lima or Bogota as “High Risk” based on current social unrest or road closures, triggering an automatic adjustment in the promised delivery window. This dynamic adjustment preserves the customer relationship by setting realistic expectations rather than failing a static promise.

    Furthermore, integrating these signals requires a deep understanding of Collaborative Planning (CPFR). When retailers and suppliers share forecasted risks, they can align on mitigation strategies. For instance, if a predictive signal indicates a 30% probability of stockout due to a port strike in Valparaiso, the system should automatically prioritize allocation to high-velocity stores, ensuring that OTIF Reliability remains stable for key accounts.

    From Lagging KPIs to Leading Indicators

    The engineering of KPIs must evolve. While Fill Rate Optimization measures the percentage of demand met, it does not explain why a cut occurred. Predictive service signals decompose the root causes of potential failures.

    • Inventory Visibility: Moving beyond simple On-Shelf Availability (OSA) to “Predicted OSA,” which calculates the likelihood of a shelf being empty based on sell-out velocity and replenishment lead time.
    • Logistics Stress Testing: Simulating the impact of volume surges on carrier capacity. This aligns with advanced Logistics Capacity Planning, ensuring that the fleet size matches the predicted demand curve.
    • Cost-to-Serve Analysis: Predictive models can estimate the fluctuating cost of delivery in real-time, allowing for smarter Service Policy Design.
     Carlos Velásquez Rada on KPI engineering and OTIF.

    As noted in recent studies by Harvard Business Review on supply chain resilience, companies that leverage predictive analytics reduce stockouts by up to 20% compared to those relying solely on historical averages. This data-driven agility is the differentiator in competitive markets.

    Implementing the Signal Framework in LATAM

    The challenges in Latin America are unique. The infrastructure gaps in regions like Colombia or Peru require a tailored approach to Last Mile Logistics. Here, predictive service signals must account for informal transit routes and variable lead times.

     Carlos Velásquez Rada discussing LATAM logistics strategies.

    To build this capability, operations leaders must focus on Digital Transformation in Operations. This involves adopting API-first architectures that allow systems to “talk” to each other. A delay registered in a WMS (Warehouse Management System) should instantly trigger a predictive alert in the TMS (Transportation Management System), updating the ETA for the end customer.

    Furthermore, the human element cannot be ignored. Training teams to interpret these signals is part of effective Operational Change Management. Planners must trust the algorithm enough to act on a warning, even if the physical problem hasn’t manifested yet.

     Carlos Velásquez Rada service policy design diagram.

    Conclusion: Mastering Predictive Service Signals

    In conclusion, the adoption of predictive service signals is the logical next step for supply chain leaders aiming for operational excellence. It transforms the supply chain from a cost center into a competitive advantage by maximizing availability and trust. By looking forward rather than backward, organizations can navigate the complexities of modern logistics with precision. As the technology matures, the correlation between predictive accuracy and market share will only strengthen, making this a mandatory competency for the future.

     Carlos Velásquez Rada governance framework visual.

    Official profile: Carlos Velásquez Rada → https://carlosvelasquezrada.com/

    About.me: https://about.me/carlosvelasquezrada

    Google Site: https://sites.google.com/view/carlos-velasquez-rada/


    🔗 Official versions of this article:

    | 🌐 WordPress | 🟧 Substack | ⚫ Medium | | 📄 Scribd | 📑 Issuu | 📘 Calameo | | 📊 SlideShare | 🔴 YouTube |